


SHOW ME THE MONEY

In 2019, Egan Bernal became the first Latin American ever to win the Tour de France and the youngest winner in 110 years.1 He “got his start riding mountain bikes in the Andes, often training above 10,000 feet, which helped him become a fierce competitor on the Alps and Pyrenees.” His preparation also enabled his recent win of the Giro d’Italia with a “dominating Stage 16 victory on the cloud-shrouded, 15,000-foot-high Giao Pass” following which “an Italian TV station proclaimed him “King of the Dolomites.””2
There are parallels in Bernal’s story to the challenges and victories observed in the emerging US cannabis industry. Every day, operators strain to climb their own Giao Pass saddled by the gravitational forces of a high cost of capital and the burden of 280E. When money is expensive and most profits (or sometimes all and then some) are siphoned off to the US Treasury, management has a choice: run a lean operation or repeatedly tap the capital markets just to keep the lights on. The environment is a training ground that forces discipline and efficiency as a matter of survival.
As these companies mature out of the amateur races with quarterly sales ramping into the tens or even hundreds of millions of dollars per quarter, how does their performance look so far?
First, a note on the analytical process: historical data is sourced manually from regulatory filings and company press releases as data services may not be reliable and companies often bury details in the notes, MD&A, or in offering docs while only showing summary data in the high-level statements. Data is then standardized for consistency in accounting. IFRS fair value adjustments on biological assets and inventory are excluded along with fair value changes of derivative liabilities, producing more comparable versions of gross profit, operating income, and earnings before tax (“EBT”). The approach is not perfect since there will be some remaining differences between GAAP and IFRS filers, and the entire amount of excluded fair value changes of derivative liabilities is assumed to be non-cash which may not always be accurate.3
Here’s how these metrics look for the big-5 at Q1 2021:
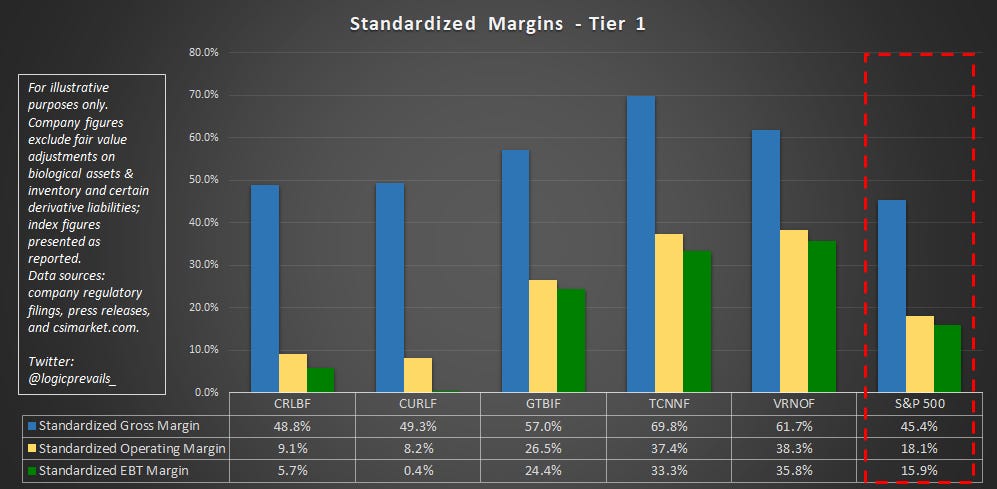
Some of the numbers seem really impressive, with GTBIF earning a 24.4% standardized EBT margin and TCNNF and VRNOF in the mid-30s, substantially exceeding S&P 500 averages.4
Here are the results for some Tier 2 names:5

There is a wide range of efficiency within Tier 2. HRVSF stands out with better results on all three measures than CRLBF/CURLF in Tier 1. TRSSF had a big jump in gross profit margin last quarter but total expenses (exclusive of fair value changes) went up even more.
Finally, a look at some Tier 3 names:6

GRAMF distorts the scale to the downside with underperformance on all metrics. GAEGF, GDNSF, and SLGWF are also notably inefficient. CNTMF has an industry-leading gross margin but lacks expense control below cost of goods sold. On the positive side, MRMD and VEXTF stand out with metrics generally better than the Tier 2s as well as CRLBF/CURLF, and have quite a bit more room to the upside with gross margin if they can catch up to sector leaders. VBSCF is also positive on all metrics even with a low 31% gross margin.
Still, all of these numbers are backward looking in an industry that is rapidly evolving every day. So why not just disregard everything other than projected sales and whatever management decides to call “Adjusted-EBITDA”?

Diagram by Brian Feroldi7
Well, these companies aren’t exactly in their infancy anymore and the growth strategy often involves scaling up through expansion and replication under a common set of standard operating procedures. Perhaps even more importantly, the industry seems to be in a hyper-growth phase subject to environmental challenges that impair operational efficiency, yet quite a few operators have managed to beat the S&P 500 average across margins and revenue growth.8
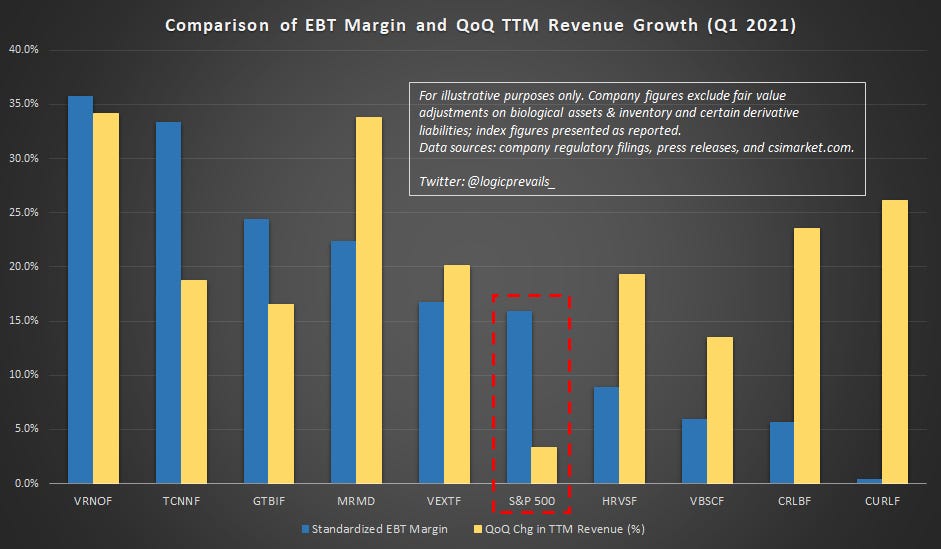
Note: EBT margin for S&P 500 presented exclusive of fair value adjustments previously described due to absence of data.
It’s been said that traditional money managers are eagerly awaiting the ability to invest in the space but there’s an open question as to whether or not they will be willing to ignore all of the things that management, bankers, and existing owners might like to sweep under rug. It wasn’t that long ago that prospective investors threw up on WeWork’s “Community-adjusted EBITDA” metric during its failed IPO attempt in 2019.
If that’s the case, wouldn’t it be improper to disregard the impact of 280E in only looking at margins down to EBT? After all, any diversified money manager who has been in the business for more than a decade knows there is a historical precedent for companies that are highly profitable with great margins but are unable to deliver net income to shareholders due to government policy.
As one example, Fannie Mae, the mortgage giant that needed a massive taxpayer bailout during the Great Financial Crisis, generated $5bn of net income to the company (+9% QoQ) on $6.8bn of net revenue in the first quarter of 2021.9 Yet even with $20bn of annualized net income, it trades to just a $13.4bn market cap10 because a condition of its taxpayer bailout was that all profits would be siphoned off to the US Treasury.11 Regulators could change that in favor of common shareholders but have declined to do so thus far. Sounds familiar.
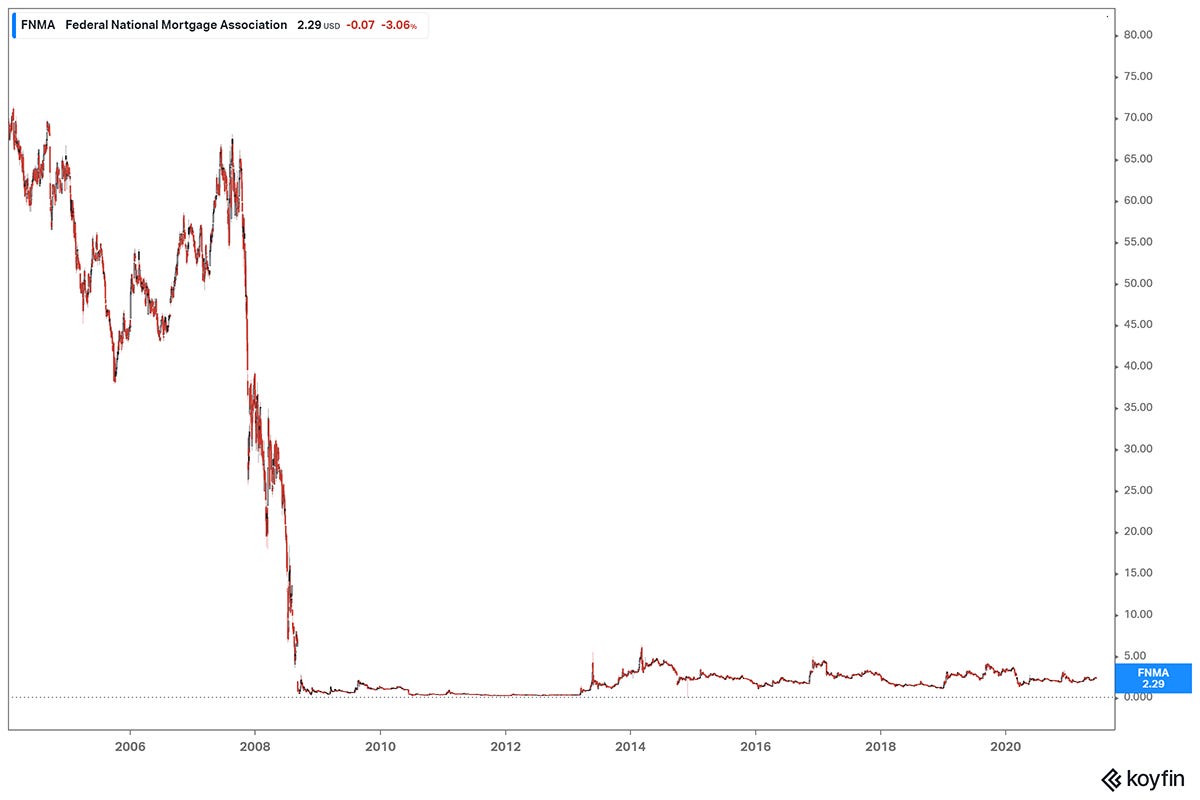
Source: Koyfin.com
Fortunately, 280E is a little different than the bailout of the mortgage giants and some of the more efficient operators (and/or tax structurers) are actually able to earn after-tax profits today. Maybe the investment thesis doesn’t have to be predicated on tax reform. Though by the time the portfolio managers at Neuberger Berman begin allocating to the space, 280E might be a thing of the past.

Note: y-axis capped on downside at-150% though GRAMF extends to -285% on standardized net margin (GRAMF reported $20mm of net income after the impact of a $131mm fair value benefit due to its own stock price decline and a $2.5mm biological fair value benefit. Backing those out gets to $114mm standardized net loss on $40mm of revenue)
GTBIF, MRMD, TCNNF, and VEXTF are all currently net income positive even with the impact of 280E, both as reported and standardized for fair value adjustments as described. This might be a characteristic that traditional managers and index selection committees appreciate, because in the long run earnings are what matter:12

None of this is to suggest that companies that have underperformed on historical metrics are by definition unattractive as investments or that any historical outperformance will continue into the future. This discussion also doesn’t consider valuation, company capital management strategies, or other critical factors of an investing framework. But unlike pre-revenue startups that can only trade off of narratives and projections, many US cannabis operators have demonstrated track records that are insightful on both a standalone and relative basis. Looking at actual results is little different than considering a roster of amateur cyclists who are seeking sponsorship and evaluating each based on their local race results and personal attributes that actually factor into race outcomes.
Of course, there will always be contestants who attempt to attract sponsorship by way of their self-promotional skills and fluency in obscuring unflattering facts. Investors seeking to identity the next Egan Bernal may be well served by looking at operators’ record of maximizing the productivity of limited resources and their underlying genetic and cultural fabric as components of an investment selection process.
Up ahead, the Giao Pass awaits.
DISCLAIMER
This material has been produced and distributed for informational purposes only. Sources for the information herein are believed to be reliable, but the information is not guaranteed as to accuracy and does not purport to be complete, and no representation or warranty is made that it is accurate or complete. The author undertakes no obligation to provide any additional or supplemental information or any update to or correction of the information contained herein. Securities highlighted or discussed in this communication are mentioned for illustrative purposes only and are not a recommendation to buy, sell, or otherwise transact in such securities. The author shall not be liable in any way for any losses, costs or claims arising from reliance on this material, which is not intended to provide the sole basis for evaluating, and should not be considered a recommendation with respect to, any investment or other matter. Past performance is no guarantee of future results. Securities discussed in this material may or may not be held in portfolios owned or controlled by the author at any given time.
Securities referenced in this material represent all securities for which the author had, at the time of writing, obtained and analyzed quarterly data for the first period ending in calendar year 2021 and does not purport to be representative of the broader universe of securities in the US cannabis sector. Security classification into tiers is subjective
FFNTF gross margin calculated using revenue from sale of goods and is exclusive of real estate income. TRSSF margins calculated using revenue net of excise and cultivation taxes
CXXIF data as at January 31, 2021


Source: Koyfin.com as at June 15, 2021

