


LIVING ON THE EDGE

In this newsletter’s inaugural issue in June 2021, I wrote about the parallels that the nascent US cannabis industry shared at the time with a young Colombian cyclist named Egan Bernal. Bernal embraced the challenge of training in a high-altitude environment, helping him to build the stamina and strength needed to outperform his competitors and win races like the Tour de France.
Seven months after that issue was published, a tragic twist of events took place when our hero slammed into the back of a parked bus at 40mph and faced the loss of career and possibly life.

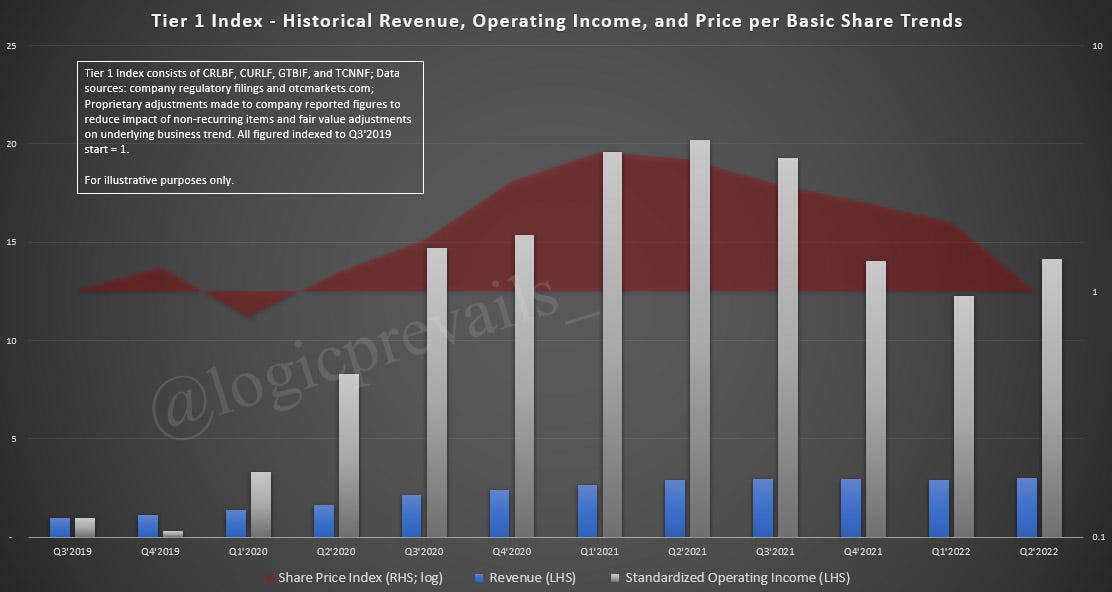
Cannabis investors and operators might agree that the parallel endured through Bernal’s crash as their own triumph turned to tragedy. The sector’s leadership in positive earnings trend and declining cost of capital led stock returns to record highs in early 2021, before all of these reversed once the temporary pandemic consumption boom in cannabis faded and macro financial conditions stopped easing.1

Bernal, however, refused to give up. He stayed focused on his goal, undergoing intense physical therapy and getting back in the saddle for international competition just seven months after almost dying.
Cannabis investors are still waiting for better days, but President Biden’s recent initiation of a review of marijuana’s classification as a controlled substance finally offers a path forward. To consider why, I want to refer back to another part of the inaugural issue in which I used the following chart to show that “in the long run, earnings are what matter” to equity investors2:

The chart shows that a range of expected prices (shown shaded in blue around a central tendency) exists for any given level of earnings. The existence of a range of potential valuations for a level of earnings means that an earnings’ multiple is a second variable that influences stock prices.
Historically, earnings multiples have been inversely correlated with the level of interest rates3:

So, for a given level of earnings, equity investors are willing to pay more to own stocks when interest rates are low, and are willing to pay less for stocks when rates are high. Conceptually, if risk-free Treasurys yielding 4% are available as they are today, the required (or expected) return on risky stocks will have to be well above that yield to be attractive to investors. Conversely, if the yield on Treasurys is closer to 0%, the required return for risky stocks should be much lower than today.
How do passive investors demand a greater return from an asset? By reducing the price they are willing to pay for it upfront.
This required return can be broken down into two components: the risk-free rate and an additional premium or spread to compensate for sector-4 and asset-specific risks. Recently, that additional spread has averaged around 1.6% for investment-grade credit5 while the spread on riskier high-yield credit has averaged 5%6. High-yield issuers have a higher expected probability of default and potentially a lower recovery rate upon default, so investors price that kind of debt to higher required returns than otherwise.

Equities are a different animal than bonds that require few assumptions to determine expected yields, but earnings per share divided by share price gives an earnings yield that represents an investor’s claim on a company’s after-tax earnings. If you’ve looked at the P/E (Price to Earnings) multiple when evaluating stocks, you’ve effectively considered the earnings yield which is the E/P.
We can visualize the hypothetical relative riskiness and required return across a sample of asset classes with what I will call the Circle of Risk:7

The basic principle here is that safety is in the center. Since cash and Treasurys are perceived to be riskless, they go in the middle. Each step out from the center adds to perceived risk, with things like real estate and investment-grade credit not too far from the center, and CCC credit (the riskiest segment of non-defaulted credit) and emerging markets further out. Since investors are only willing to accept more relative risk for higher relative expected returns as compensation, required returns increase with each move out from the center.
We can see now how there would be a ripple effect through all asset prices when risk-free interest rates go up: every risky asset class needs its yield to reprice in a way that accounts for the increased attractiveness of cash and Treasurys. If they didn’t, investors would simply transition their portfolios toward the center of the circle to achieve their return targets with lower levels of risk.

Rising interest rates can also hit equity valuations from their impact on company earnings. Consumers may choose not to make purchases when faced with higher financing costs, or may have less discretionary income available for cash purchases after spending more of their money on interest for financed purchases like housing and vehicles. Companies also face higher costs as interest expense goes up, resulting in lower earnings from both lower revenue and higher expenses.
This framework explains how the cannabis sector rerated higher in price after Democrats won the Georgia runoff election: the sector-specific premium over the risk-free rate reduced toward the lower premium that investors demand of high-growth names operating in traditional equity sectors. And it also explains the slow-and-steady reversal of that reduction in premium once expectations for federal reform peaked in early 2021 and investors increasingly lost confidence that the stocks would find a home in traditional managers’ portfolios sooner rather than later. Compounding the problem to the downside was a declining earnings trend that showed up in the second half of 2021.
So, where does the sector’s valuation go from here? If you guessed that you need to predict what happens at both a macroeconomic level (regarding the level of interest rates and the health of the consumer) as well as at the sector level (expectations of federal reform and earnings impact from things like supply/demand balance and the illicit market), you’re correct.
Piece of cake, right?
We could spend an eternity debating these individual points and probably end up far from the truth that actually writes history, so I will start with keeping things simple by considering what the potential downside is from current levels (I assume readers have a sense of the potential upside).
One of the better proxies that I have found for assets at the riskier edge of the spectrum is the CCC corporate bond yield. This yield captures both the risk-free rate and the additional spread that investors demand to hold CCC corporate bonds, which are debt obligations of companies that have a high probability of default.
Here's how a US cannabis sector ETF has performed relative to this index since the ETF’s inception8.

Note the inverse relationship between CCC yields and the price of the ETF, with many of the local peaks or troughs in the share price lining up in timing with local troughs or peaks in the CCC yield. Note also the coincident response in each to changes in direction and acceleration of trend. It’s apparent that much of cannabis stock returns to date may be explained by macro factors that drive the economy-wide price of risk and money.
Since a majority of economists predict a recession in the next twelve months, historical CCC yields during prior recessions might offer a clue as to what lies ahead9.

Setting aside the flareup in 2016 (which was driven by an implosion in the energy sector rather than an economy-wide contraction), the recessions of 2001, 2008-2009, and early 2020 each showed varying degrees of stress in the credit markets. In each of those cases, the peak yield on CCC bonds was higher than the 17% level that has prevailed lately, ranging from about 20% in 2020 to 45% in 200810.
If history offers any guide, things could still get worse for risk assets before they get better. But as represented by the CCC yield, they also look like a much more attractive opportunity to enter into at today’s current levels than they did at their historic lows in 2021.
Still, this broad-based index says nothing about the specifics of cannabis equities and the premium they deserve. That is where the greatest potential for change may exist.
Roll the clock back to early October and the probability of federal reform occurring seemed to approximate zero with Senators Schumer and Booker blocking any legislation that could actually get votes to pass. And with the expectation of change in control of at least one chamber of Congress in 2023 and a potential loss of the presidency after 2024, investors had begun eyeing 2029 or later as the likely timeframe for federal reform.
All that changed with Biden’s order for a review of marijuana’s scheduling status on October 6th11.

Experts on the regulatory process as well as sector analysts are guiding to a likely resolution in 2024. If you believe that the end state of the sector-specific premium is a level more consistent with that of consumer discretionary, staples, and healthcare stocks, the multiple on cannabis stocks should accrete over time in the direction of those sectors. In other words, with Biden’s actions, the rerating of the sector toward a higher multiple was arguably given a green light to proceed on an accelerated basis.
That’s not to say it is all rosy days ahead as cannabis equities try to step inward in our Circle of Risk. CCC yields spent three years at rates higher than today’s in the early 2000s and almost a year in 2008-2009. Operators still need to survive what could be a protracted period of tighter financial conditions while the Fed willfully increases “pain” among households and businesses. Changes to federal regulation from Congress or the courts remain wildcards, as does the specific outcome of Biden’s review. And sector earnings may still get worse before they get better, so considerations in avoiding permanent trouble remain applicable.
There are lots of possibilities and uncertainties. But for now, investors might just be out of the ICU and back on the saddle.

Subscribe to avoid missing the next issue! And follow along on Twitter for timely commentary.
DISCLAIMER
This material has been produced and distributed for informational purposes only. Sources for the information herein are believed to be reliable, but the information is not guaranteed as to accuracy and does not purport to be complete, and no representation or warranty is made that it is accurate or complete. The author undertakes no obligation to provide any additional or supplemental information or any update to or correction of the information contained herein. Securities highlighted or discussed in this communication are mentioned for illustrative purposes only and are not a recommendation to buy, sell, or otherwise transact in such securities. The author shall not be liable in any way for any losses, costs or claims arising from reliance on this material, which is not intended to provide the sole basis for evaluating, and should not be considered a recommendation with respect to, any investment or other matter. Past performance is no guarantee of future results. Securities discussed in this material may or may not be held in portfolios owned or controlled by the author at any given time.
For ease of interpretation, data shown in the ‘Tier 1 Index’ chart represent a simple addition of assumed per share values which disproportionately weighs the impact of certain companies. As an alternative, here is a representation of the simple average of each series adjusted for dilution and indexed to its starting point:


The term ‘sector’ is used throughout this piece but may alternatively be substituted with ‘asset-class’ in the context of non-equity assets
Source: https://fred.stlouisfed.org/series/BAMLC0A0CM as at November 9, 2022
Source: https://fred.stlouisfed.org/series/BAMLH0A0HYM2 as at November 9, 2022
For illustrative purposes only. May not reflect historical or future performance of assets’ risks or returns.
Source: koyfin.com
Source: koyfin.com
Source: koyfin.com

Additional sources:
Images of Egan Bernal: https://www.instagram.com/eganbernal/
Screenshot and quote of Rick Rieder:

